Observe, Measure, Manage – Sekom’s End-to-End Monitoring Engineering
27 Nov 2025
Author: Mehmet Kutay Eroğlu – Cloud Technologies Engineer – Sekom
Author: Burak Ceviz – DevSecOps & Cloud Operations Engineer – Sekom
Our expectations from modern digital infrastructures go far beyond simply saying “it works.” Today, we need to understand how systems operate, where they struggle, and how they can be improved. Sekom builds this advanced engineering practice on the strength of the open-source ecosystem and an automated action loop.
Our core objective is to generate meaningful insights by unifying metrics, logs, events, and traces; convert these insights into action through the Ansible Automation Platform (AAP); and ensure continuous improvement of user experience while reducing operational costs.

1. Why Observability Powered by Open Source?
Our choice to build an observability architecture on open-source technologies is driven by three principles: industry-wide standardization, full transparency, and operational flexibility.
- Standardization and Complementarity : By adopting global standards such as OpenTelemetry/OTLP and OpenMetrics/PromQL, we avoid being locked into a single ecosystem. These standards allow us to easily forward data to enterprise APM solutions or proprietary security platforms. Open-source tools provide the flexibility to create a complementary data layer that enhances your existing enterprise investments.
- Transparency and Security : Open source offers full visibility into the codebase, enabling robust security reviews, SBOM (Software Bill of Materials) tracking, and independent audits for critical systems.
- Flexibility : With the ability to develop custom exporters, perform selective data collection using Kubernetes CRDs, and extend architectures with eBPF signals, we can build our own solutions even in niche areas that commercial vendors do not cover.
- Data Governance : With components like Mimir and Loki, we provide horizontal scalability and long-term data retention on object storage, ensuring data locality and regulatory compliance.
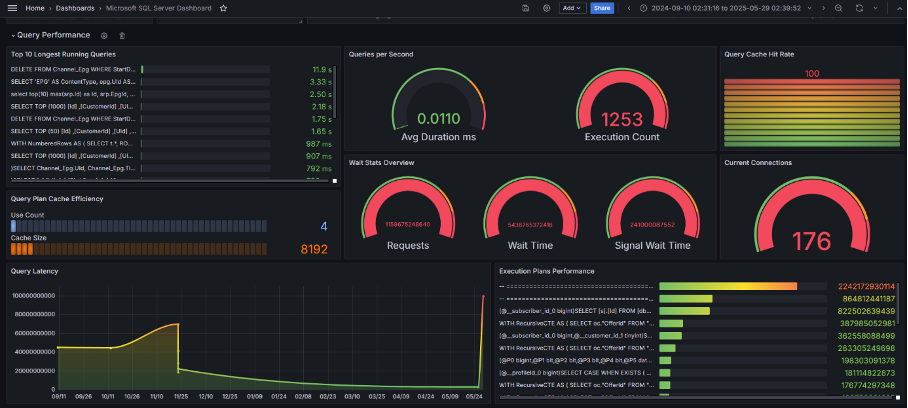
2. Sekom’s End-to-End Architectural Approach
We transform your systems from isolated “alarm-producing boxes” into a clear, measurable, and sustainable operational platform.
2.1. OpenTelemetry (OTel): The Universal Data Standard
OTel is the universal language for collecting and transmitting all observability data types, metrics, logs, events, and traces.
- Collectors : OTel Collectors aggregate data and automatically enrich it with contextual labels such as cluster, namespace, and service, ensuring every signal is traceable and meaningful.
- Custom Transformations : For AI workloads, we harmonize GPU hardware metrics (e.g., DCGM) with application-level schemas by renaming them through metricstransform.
( Example : DCGM_FI_DEV_GPU_UTIL → gpu_util_percent ) This allows GPU insights to align seamlessly with standard monitoring structures.
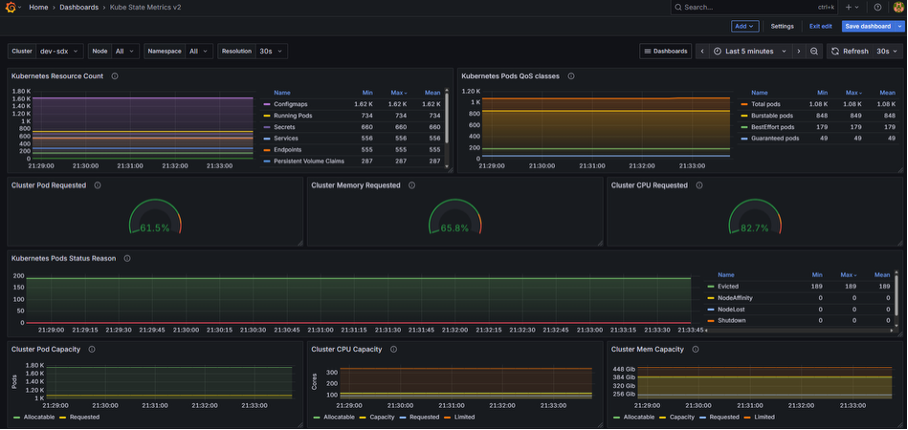
2.2. Prometheus & Mimir: Scalable Metric Management
Prometheus is the backbone of modern observability. Mimir provides horizontally scalable, multi-tenant long-term storage for metrics.
- Area of Expertise : We go beyond traditional infrastructure metrics. Our approach includes collecting outcome-driven, application-level and AI/ML-specific metrics such as inference_queue_depth and generated_tokens_total, enabling teams to measure what truly impacts business performance.
- The Power of PromQL : With PromQL, we directly compute critical Service Level Indicators (SLIs) such as p95/p99 latency and tokens/sec, ensuring precise, real-time visibility into system health and performance.
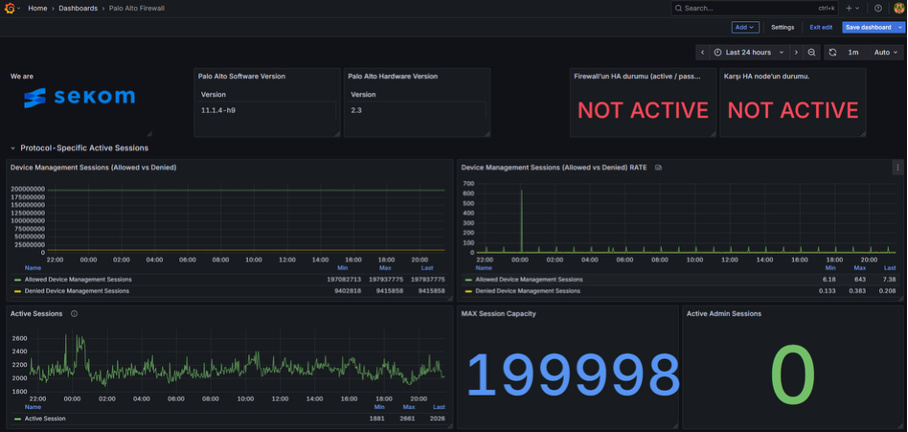
2.3. Elasticsearch & Loki: Correlated Log Management
Logs are the answer to the “why did it happen” question behind the “what happened” described by metrics.
- Log Enrichment : We parse log data with Logstash and enrich it with IP and user-agent details.
- Data Storage : Managed through Elasticsearch (events and enriched logs) and Loki (large-scale, unindexed log storage).
- ILM : We optimize retention costs by applying Lifecycle Management (ILM) policies based on data type.
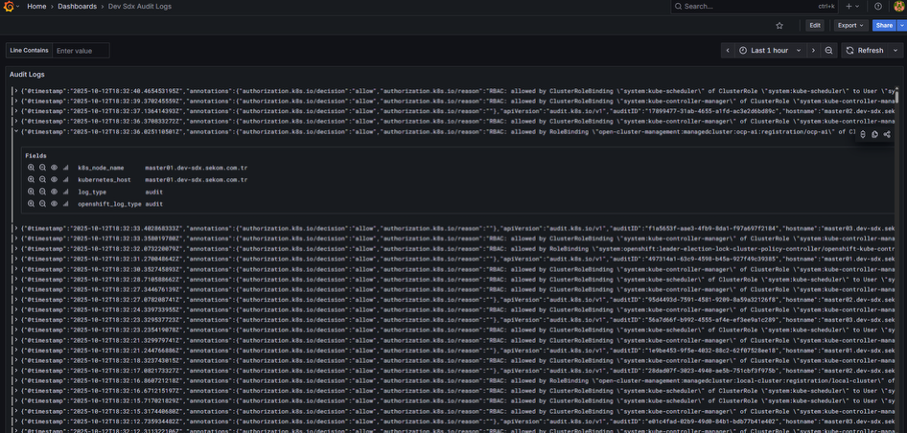
2.4. Jaeger & Tempo: Microservices Tracing
They provide end-to-end visibility into all services a request passes through in microservices architectures.
- Root Cause Analysis : Through trace analysis, we instantly identify how much time a request spends in each service and correlate it with relevant logs and metrics. This reduces root cause analysis to mere seconds.
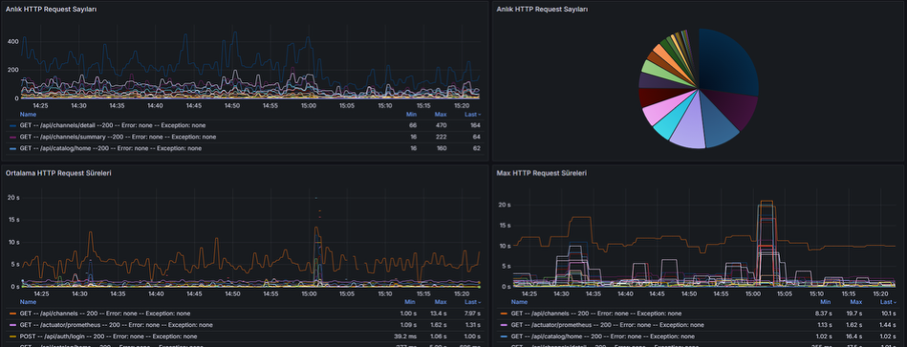
2.5. Grafana: Visualization and Action Center
Grafana is the decision-making hub where all data sources converge in a single interface.
- Correlated Dashboards : Data from all sources, such as Prometheus, Loki, and Elasticsearch is displayed on a single dashboard with aligned time windows.
- Action from the Dashboard : The Signal → Decision → Action loop is initiated through AAP job templates triggered either directly from the dashboard or via Alertmanager signals.
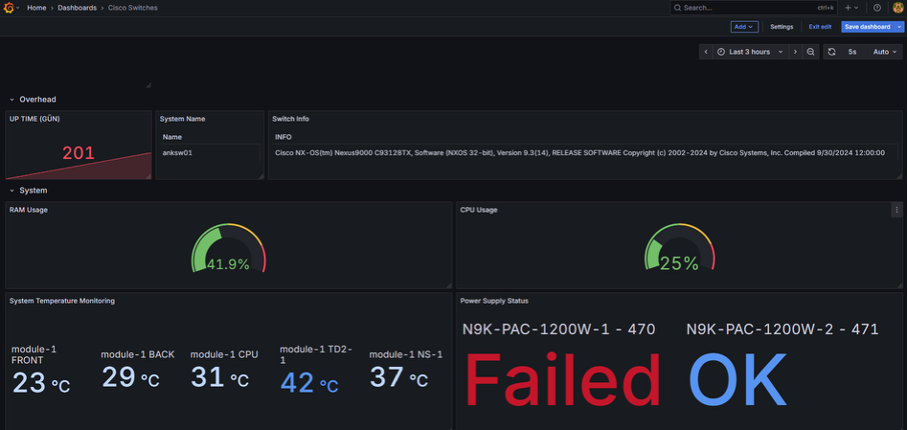
3. The Closed Loop with Automation (AAP & EDA)
The real value of our observability platform lies in turning collected data into automated actions.
- SLO Focus : We base our alerts on business objectives such as error budget consumption (burn rate) to prevent alert noise. Runbooks prepared for each critical alert are executable automation recipes on AAP.
- Rapid Response : Signals emitted from Prometheus Alertmanager are received by Event-Driven Ansible (EDA) and instantly trigger the relevant AAP jobs.
| Automation Scenario | Triggering Signal (Alert) | Automated Action (AAP Job) |
|---|---|---|
| Service Rollback | Sudden 5xx spike on Ingress (Ingress5xxSpike) | Automatic canary rollback to the last successful release with Argo Rollouts |
| Capacity Scaling | Increase in application queue depth (inference_queue_depth > 10) | Raising the maximum replica count of the HPA |
| Infrastructure Remediation | Node not ready for service (NodeNotReady) | Cordon + drain the affected node |
| Cost Protection | When the retention threshold is exceeded | Automatically activating Downsampling/ILM policies for Mimir/Loki |
Conclusion
Observability is the art of transforming metrics, logs, events, and traces into a single meaningful context. At Sekom, we build this architecture end-to-end, combining it with our long-standing datacenter infrastructure expertise to ensure that collected data continuously drives insight and automation.
This enables your infrastructure to evolve from a passive system that merely reacts to issues into a digital organism that supports business objectives, continuously improves, and self-heals.
You can contact us to build an end-to-end monitoring solution for your observability architecture.

