Understanding Modern Systems: End-to-End Visibility with Splunk Observability
25 Jun 2025
Author – Metin Latifoğlu – VAS Team Lead – Sekom
Given the increasing complexity of modern systems, traditional monitoring methods have become insufficient. This article explains how Splunk’s observability solutions provide end-to-end visibility from infrastructure to applications, and how integrated solutions are delivered using tools like AppDynamics, ITSI, and Observability Cloud.
With trends evolving rapidly over the last decade, today’s systems have become too complex to be monitored from a single point. These systems can be on-premises, hybrid, or cloud-based, and may use monolithic or microservice architectures. Managing these diverse service models from a unified view introduces various challenges—monitoring alone is no longer enough. This is where observability comes into play. Achieving business goals (SLAs and SLOs), detecting and resolving problems faster (MTTD/MTTR), improving customer experience, and increasing operational efficiency and optimization are all made possible through observability.
What Is Observability?
Observability is the ability to understand the state of a system by collecting metrics, logs, and traces, and using them to understand what is happening, why it’s happening, and what needs to be done. To achieve this, data must be collected from all system components—such as infrastructure, networks, applications, and databases. Splunk provides end-to-end visibility with its full-stack portfolio, and by not sampling data, it avoids blind spots entirely.
OpenTelemetry
In the observability world, how data is collected is just as important as the data itself. This is where OpenTelemetry, an open-source project supported by the Cloud Native Computing Foundation (CNCF) and actively developed by Splunk, becomes essential.
The importance of OpenTelemetry :
- Data collection agents can be added independently to applications.
- A unified data model allows seamless data transmission to tools like Splunk and AppDynamics.
- It reduces vendor lock-in and ensures sustainability of your observability strategy.
Splunk Observability Portfolio
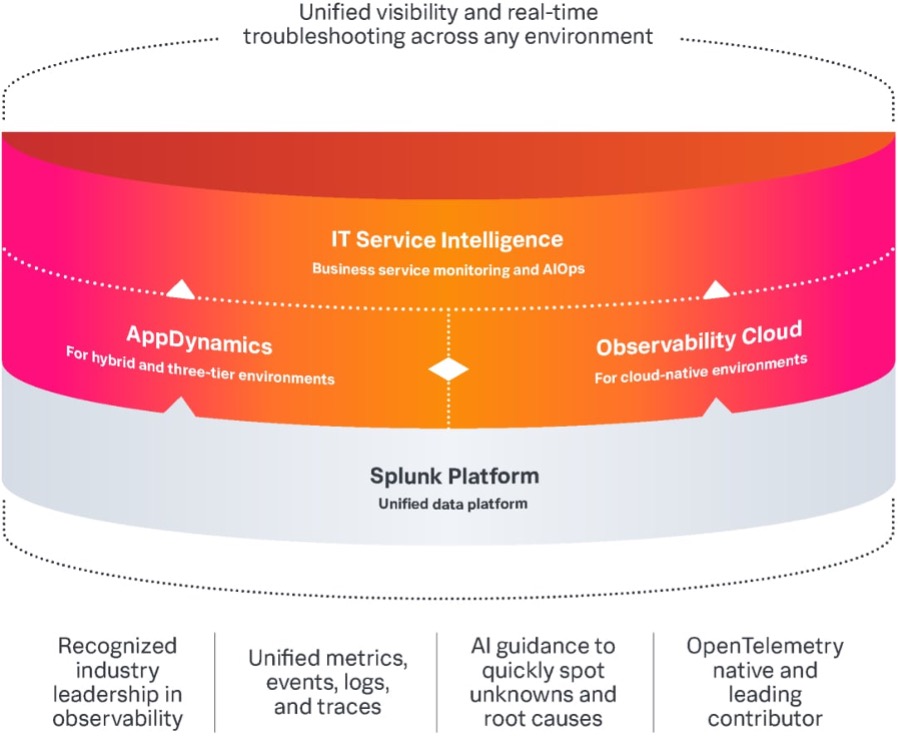
With its underlying Splunk Platform, and extensions like Splunk AppDynamics, Splunk Observability Cloud, and Splunk ITSI, Splunk offers tailored solutions for different roles and needs in modern distributed systems. These solutions work in a complementary manner.
The main goals of this portfolio are to :
- Unify application, infrastructure, and user experience data on a single platform.
- Trace performance issues to their root cause with real-time analysis.
- Enable different teams (DevOps, SRE, IT Operations) to collaborate through a common data source.
Splunk AppDynamics
Following Cisco’s acquisition of Splunk, AppDynamics became part of the Splunk portfolio as an Application Performance Monitoring (APM) solution. It is designed to monitor three-tier applications and hybrid environments. It also supports monolithic structures, enterprise applications, and traditional mission-critical systems (e.g., Java, .NET, SAP, Oracle).
Key features that differentiate AppDynamics :
Code-Level Insights
AppDynamics provides more than just general response time metrics; it can drill down to the specific line of code or module where latency occurs. This allows developers and application teams to quickly identify and resolve root causes of performance issues.
Business Transaction Tracing
AppDynamics automatically maps and monitors end-to-end workflows of user requests within applications. Performance metrics, errors, and bottlenecks can be analyzed per transaction, clarifying the impact on user experience.
AI-Powered Anomaly Detection
By learning historical behavior patterns, AppDynamics generates baseline performance profiles. It detects abnormal behaviors in real time using AI, reducing false positives and providing proactive alerts for meaningful anomalies.

By generating application flow diagrams and tracking them with metrics, AppDynamics contextualizes performance delays, shortens investigation and resolution times, and allows operations teams to work more efficiently.
Splunk Observability Cloud
This is Splunk’s cloud-native observability solution, aimed at delivering real-time, high-resolution, and holistic visibility for microservice architectures, container-based infrastructure, and CI/CD systems.
Core Components
- Infrastructure Monitoring : Monitor Kubernetes, container, and cloud resources in real-time, using system metrics like CPU, memory, and network usage. It supports alarm creation, dashboard visualization, and simplified system tracking.
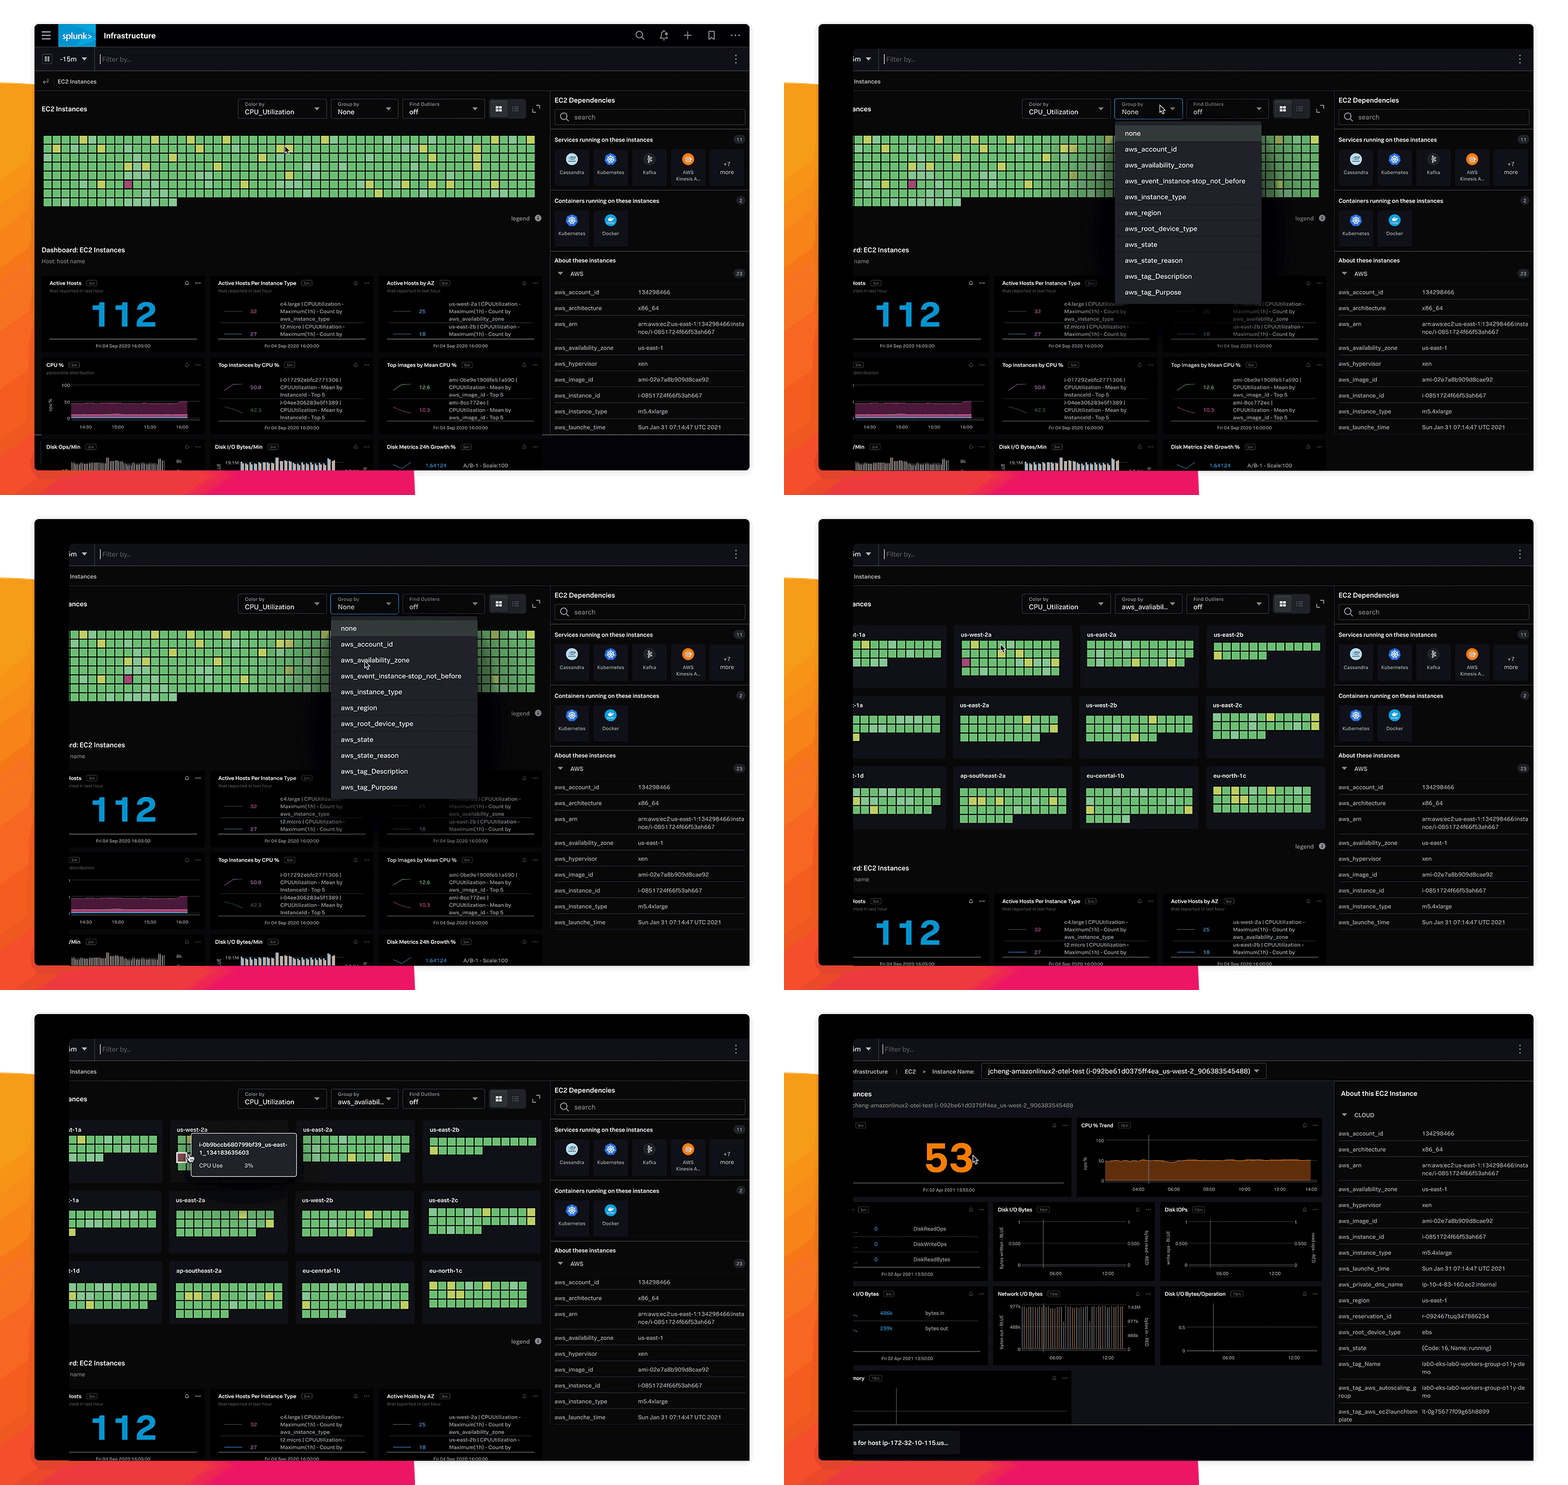
- Application Performance Monitoring (APM) : Using distributed tracing, it provides visibility into microservice interactions. Service maps and flow tracking, along with AI-driven recommendations, help easily identify problematic services.

- Log Observer : Allows real-time analysis of logs alongside metrics and traces. Integrated with APM and infrastructure monitoring, it simplifies anomaly detection and root cause analysis.

- Real User Monitoring (RUM) : With features like Session Replay, it enables tracking of real user experience from frontend to backend in context, making it easier to pinpoint root causes.

- Synthetic Monitoring : Continuously tests systems without user actions. Monitors web pages and APIs to detect and resolve issues before customers are affected. Tracks SLAs and SLOs to report uptime and performance.

Splunk ITSI
Splunk IT Service Intelligence (ITSI) focuses on monitoring the health of business services as a whole, rather than just individual systems, especially across complex infrastructures and distributed applications. By aggregating infrastructure, application, and user data, it transforms technical signals into meaningful business service scores and visualizations. It enables real-time visibility not just into system status, but also into its impact on business services.
ITSI benefits include :
- Generating service health scores
- Detecting correlations and anomalies
- Bridging the gap between IT operations and business processes

At a recent Splunk Partner Enablement event, Splunk teams shared their vision for tighter integration between AppDynamics and other Splunk solutions, as well as their plans to leverage AI at every stage of observability. In today’s business environment, observability has shifted from being a luxury to becoming a necessity.
As Sekom, we aim to meet our partners’ and customers’ needs in this domain by leveraging our expertise in infrastructure, Splunk, and 3rd-party solutions. Our mission is to simplify business tracking and add value through our specialized services.
Frequently Asked Questions About Observability
What is Observability?
Observability is the ability to understand a system’s internal state by examining its outputs—metrics, logs, and traces.
How is Observability different from Monitoring?
Monitoring usually focuses on current status, while observability allows you to understand why issues occur and respond faster, not just identify them.
Can Splunk be tried for free?
Yes, Splunk Observability Cloud can be tried for free using the following link:
https://www.splunk.com/en_us/download/o11y-cloud-free-trial.html
We can also arrange a demo for other solutions if you’re interested.

