Visibility in Modern Data Centers: Discover Cisco MDS SAN Analytics
26 Feb 2020
In today’s digital world, data has become one of the most valuable assets for businesses. However, beyond storing and managing this data, the effectiveness and efficiency of these processes are also critically important. Optimizing the performance of Storage Area Networks (SAN), predicting potential issues, detecting them, and resolving them quickly are essential for businesses to maintain uninterrupted operations.
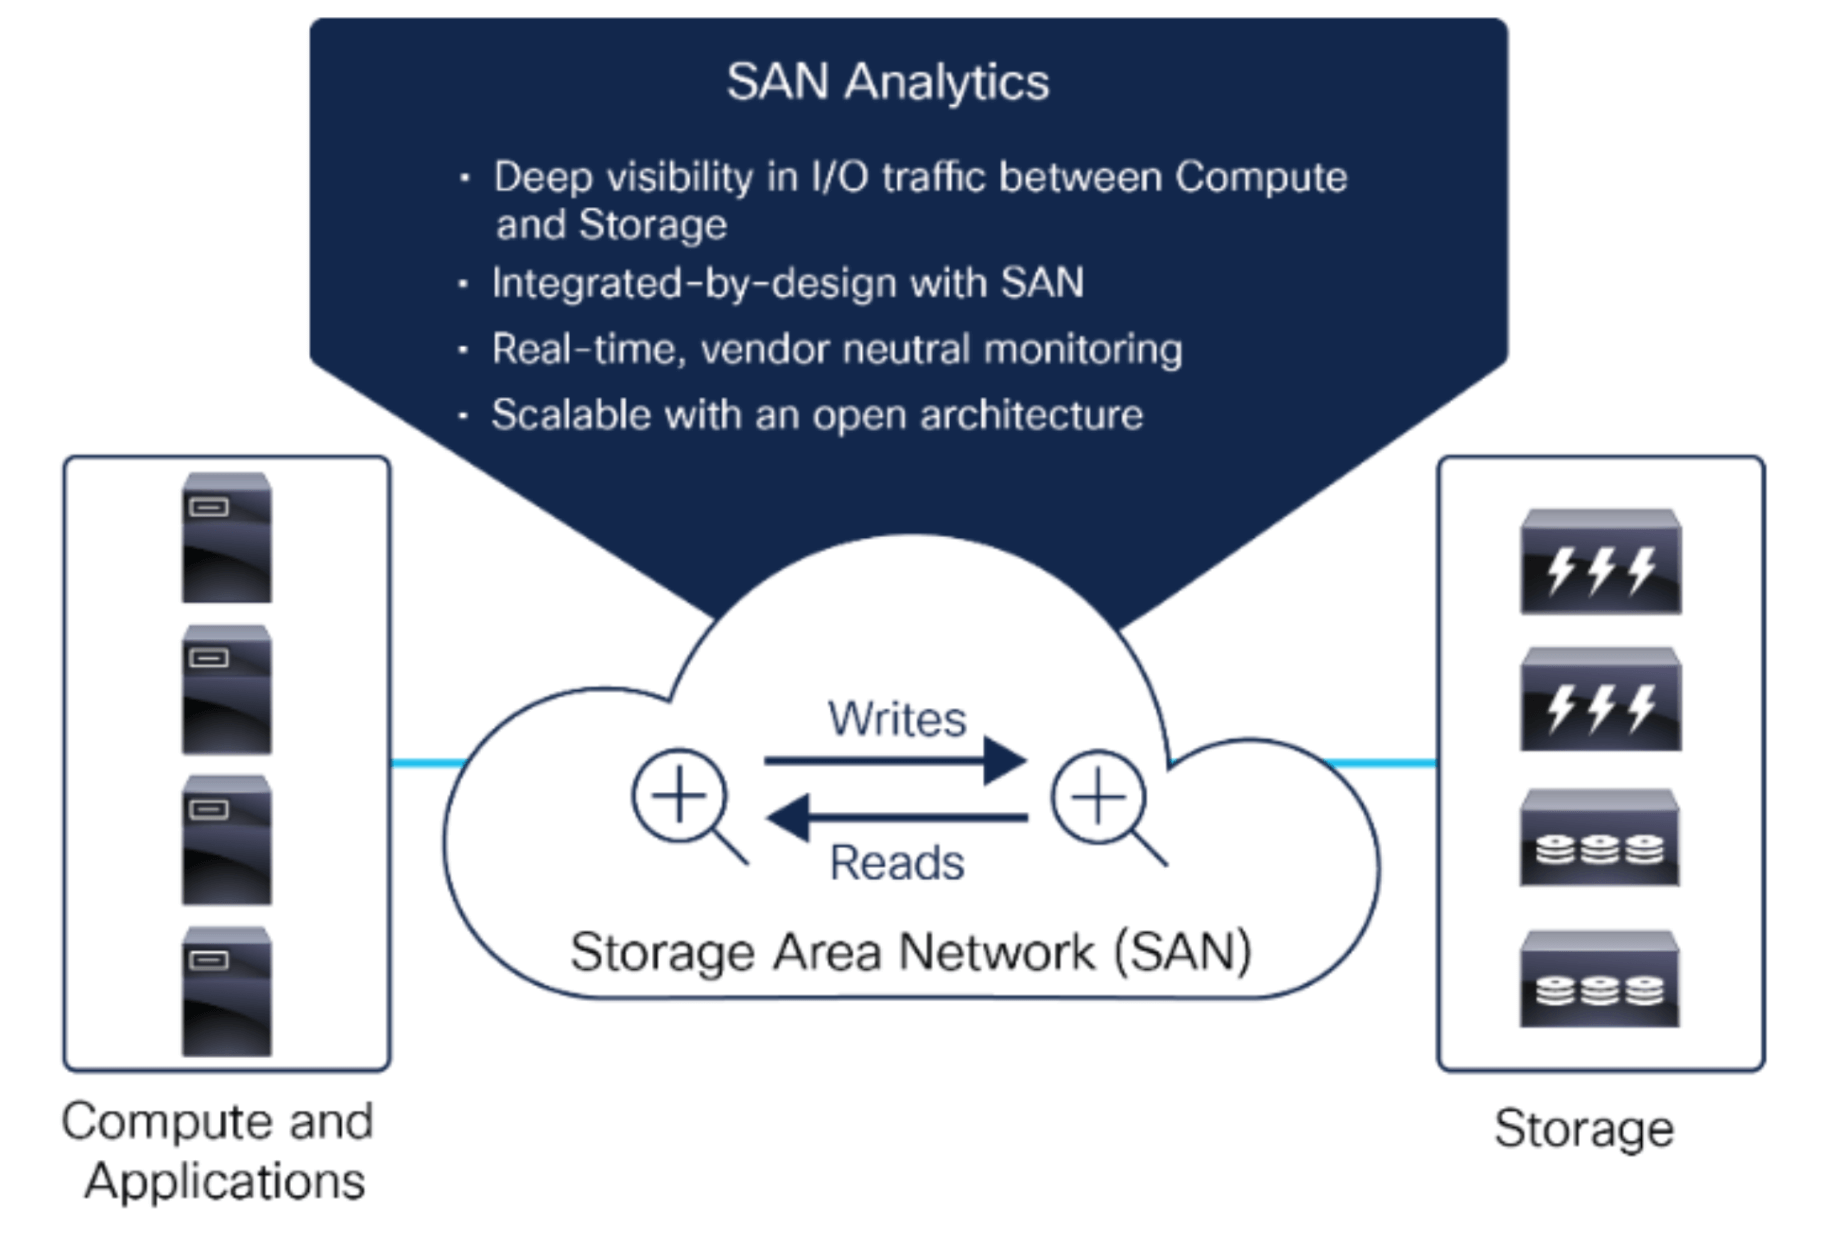
Cisco MDS SAN Analytics steps in at this point, providing real-time monitoring and analysis of data exchange within the SAN environment. In this article, we will discuss why visibility in SAN environments is crucial and explore the benefits offered by this technology.
What is Cisco SAN Analytics?
Cisco SAN Analytics is a real-time telemetry and analytics solution developed for storage networks. Integrated with Cisco MDS series SAN switches, this technology continuously monitors data exchange to ensure optimal performance across the storage infrastructure. It helps detect and resolve network issues quickly, maintaining seamless operations.
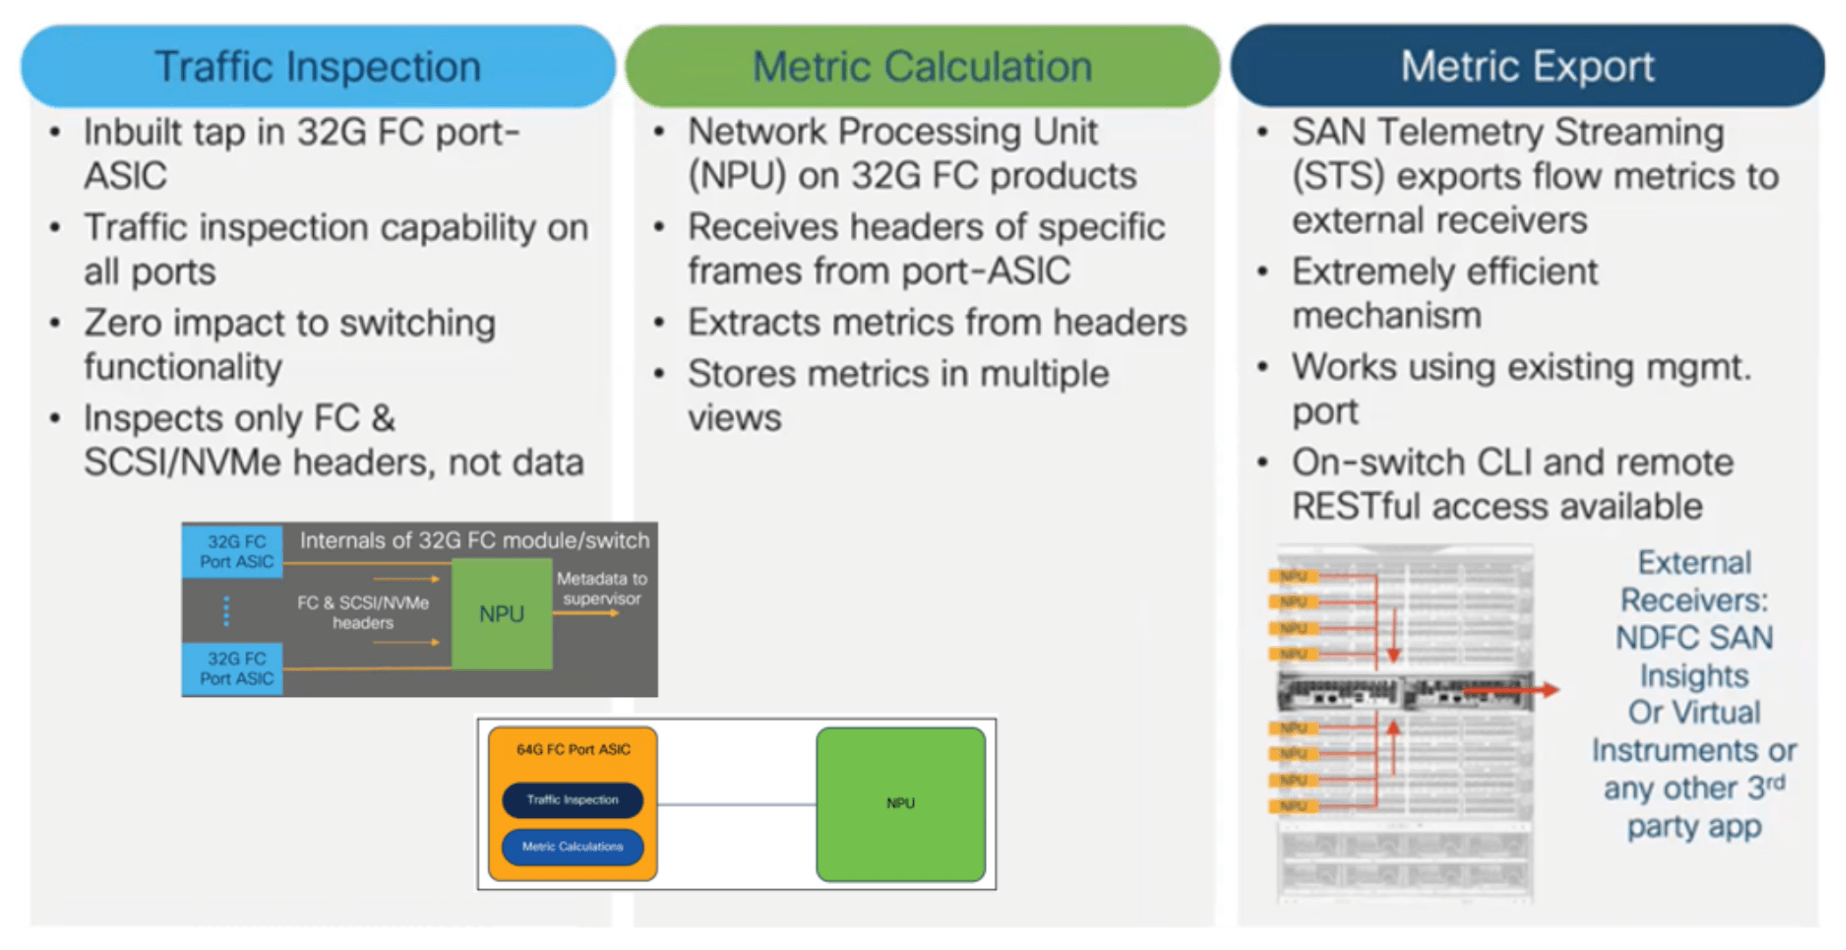
SAN Analytics does not affect switch performance. The 32Gb port ASICs transmit SCSI/NVMe header information within FC packets to the NPU (Network Processing Unit). The NPU processes this data and calculates metric information. The 64Gb port ASICs, on the other hand, also calculate metric information. Telemetry data includes these metrics and can be collected from any point within the fabric.

Cisco SAN Analytics Metrics
Telemetry data carries approximately 70 metric data points. These metrics can be utilized for anomaly detection, application performance troubleshooting, and optimization. The metrics are categorized as follows:
- Flow Identity Metrics
- Metadata Metrics
- Latency Metrics
- Performance Metrics
- Error Metrics
- Interface Metrics
The Three Most Critical SAN Analytics Metrics
There are three key metrics that are particularly useful for identifying the source of latency within a SAN network: ECT, DAL, and HRL.
- Exchange Completion Time (ECT): The total time taken to complete an I/O operation.
- Data Access Latency (DAL): The time taken for a target to send the first response to an I/O operation. An increase in DAL may indicate a storage-related issue.
- Host Response Latency (HRL): The time taken for a host to respond after learning that the target is ready to receive data for a write I/O operation. An increase in HRL may indicate a host-related issue.
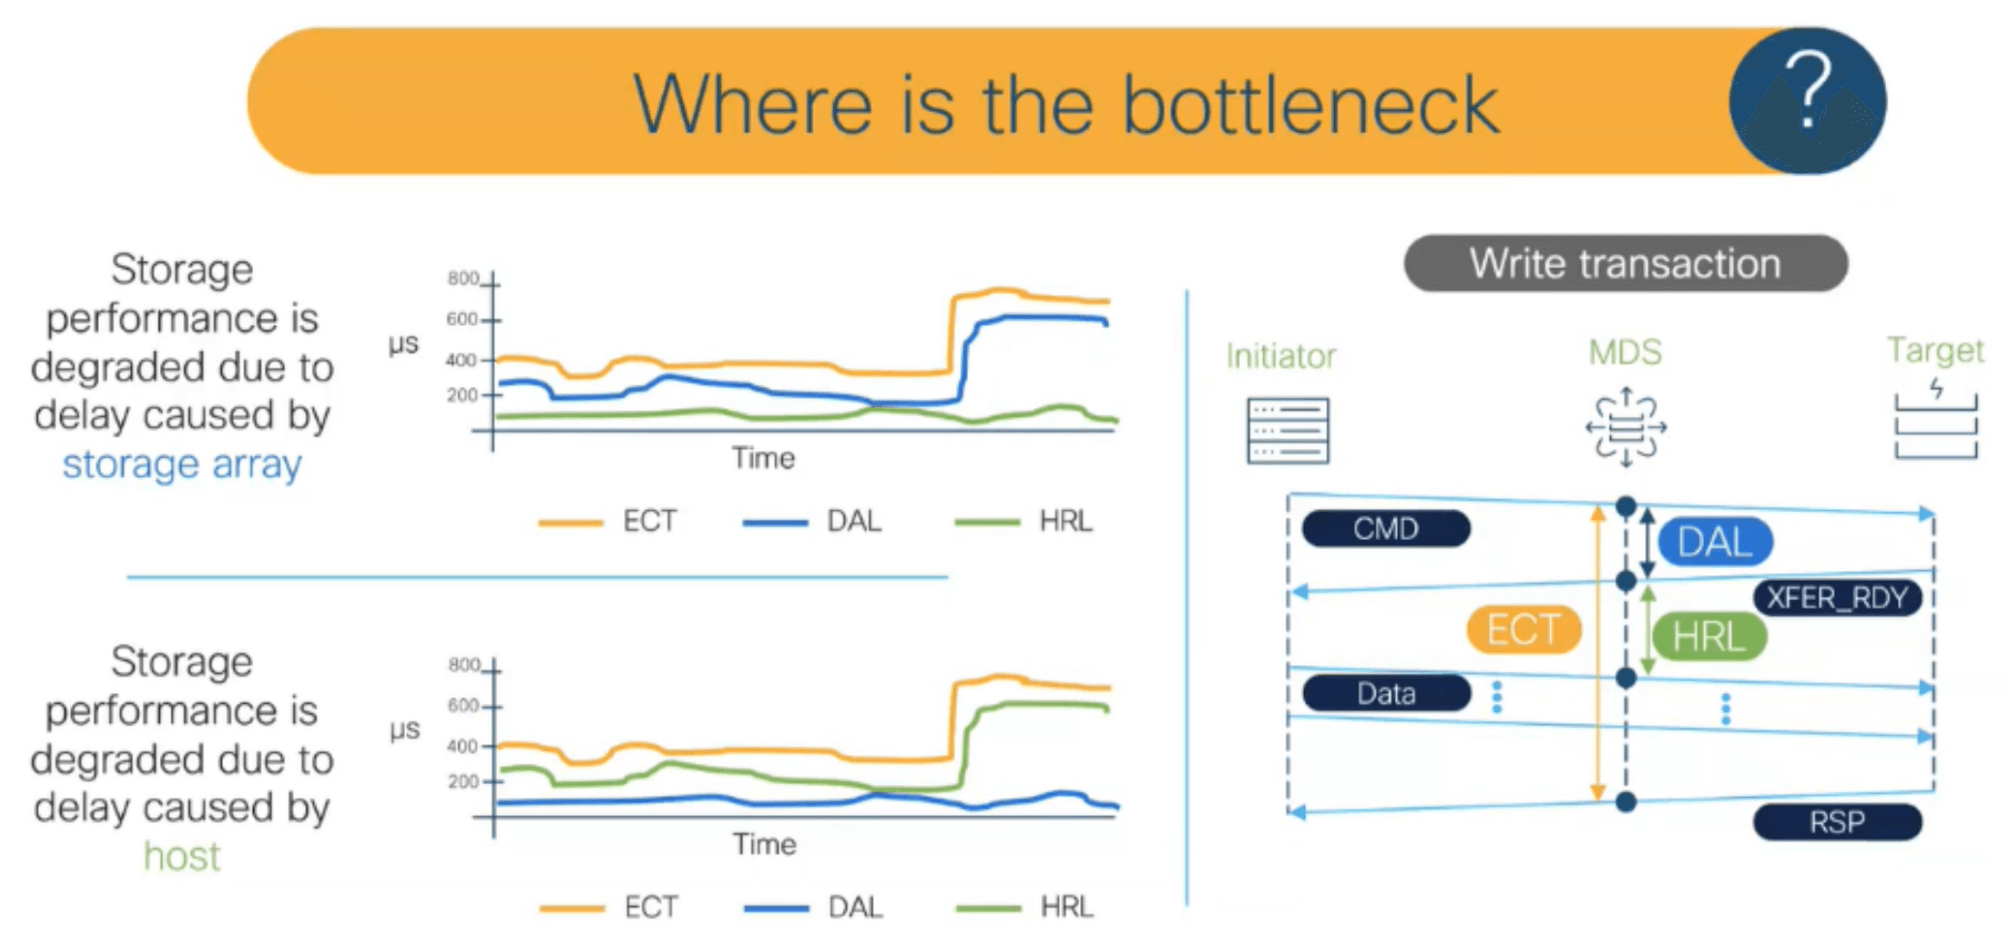
By tracking the historical performance of these metrics through telemetry data, it is possible to determine when and why a problem occurred.
Cisco NDFC Telemetry Insight
Cisco NDFC (Nexus Dashboard Fabric Controller) is a centralized management, reporting, and automation solution for Nexus and MDS switches.
With NDFC, you can implement necessary configuration changes for daily operations within your SAN fabric. It also enables you to monitor the status of SAN switches and their connected hosts and storage devices, manage firmware, set up alarms, and control access based on user roles.
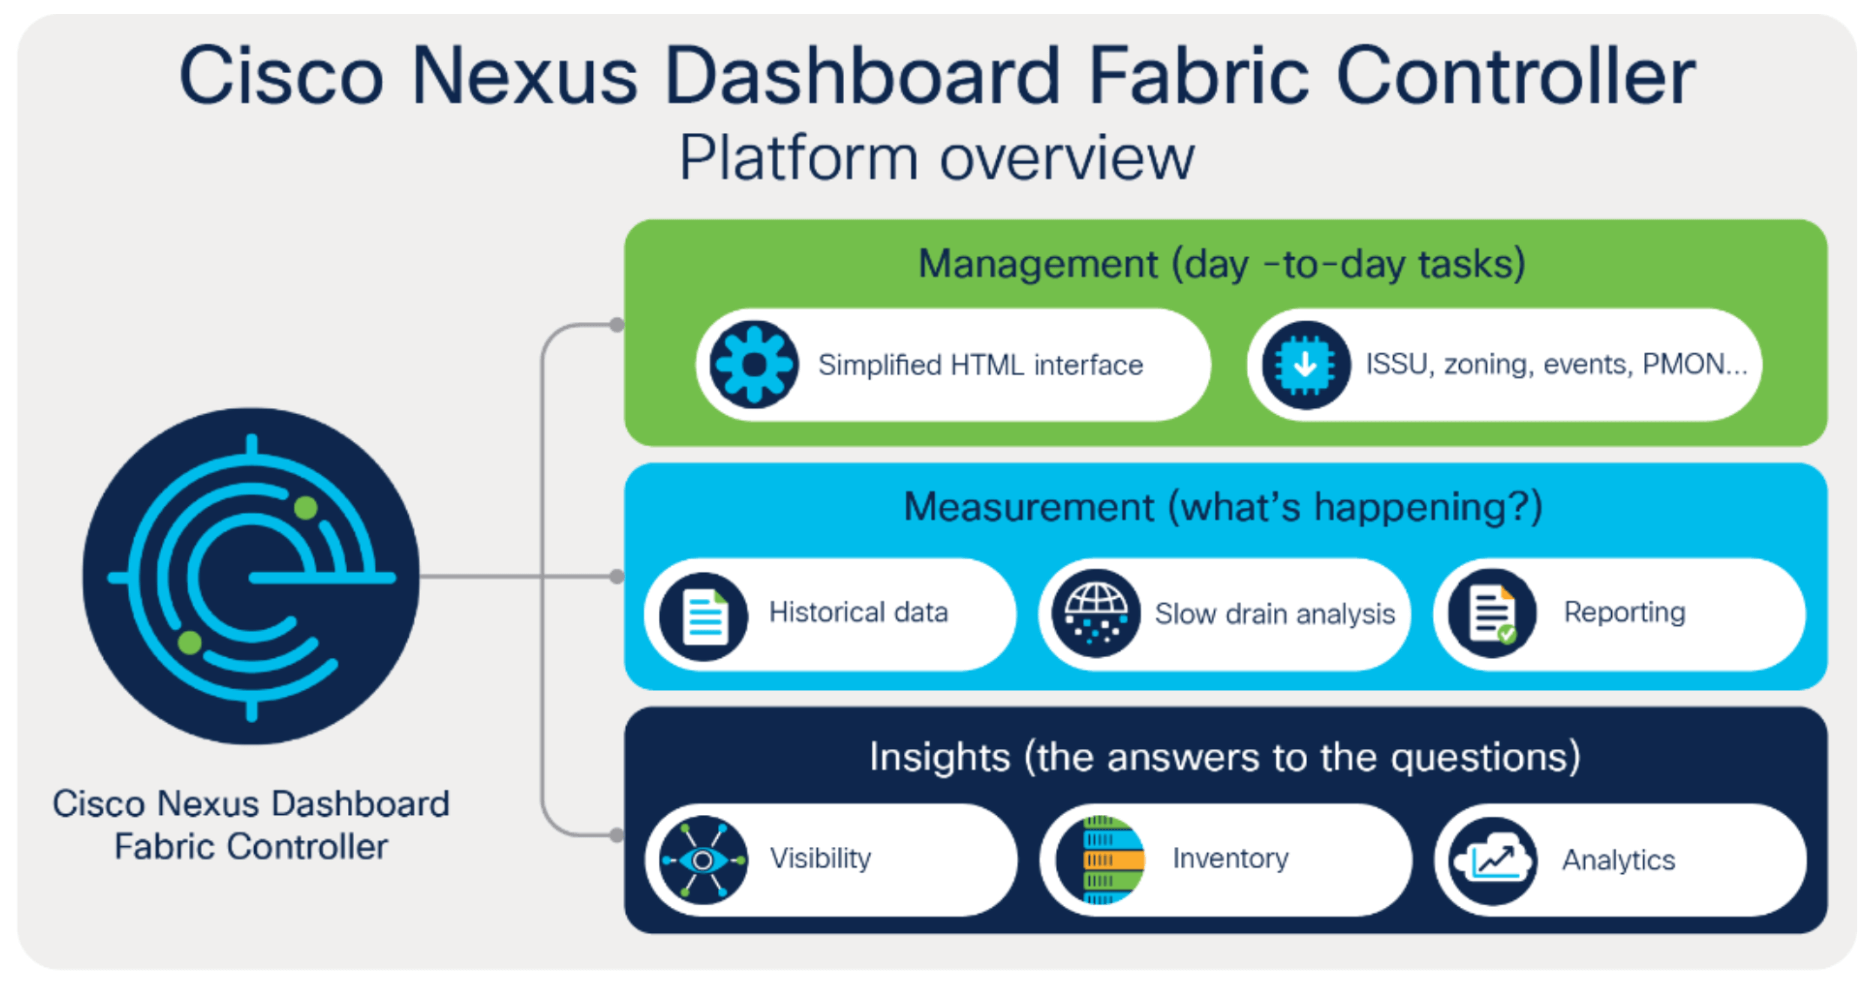
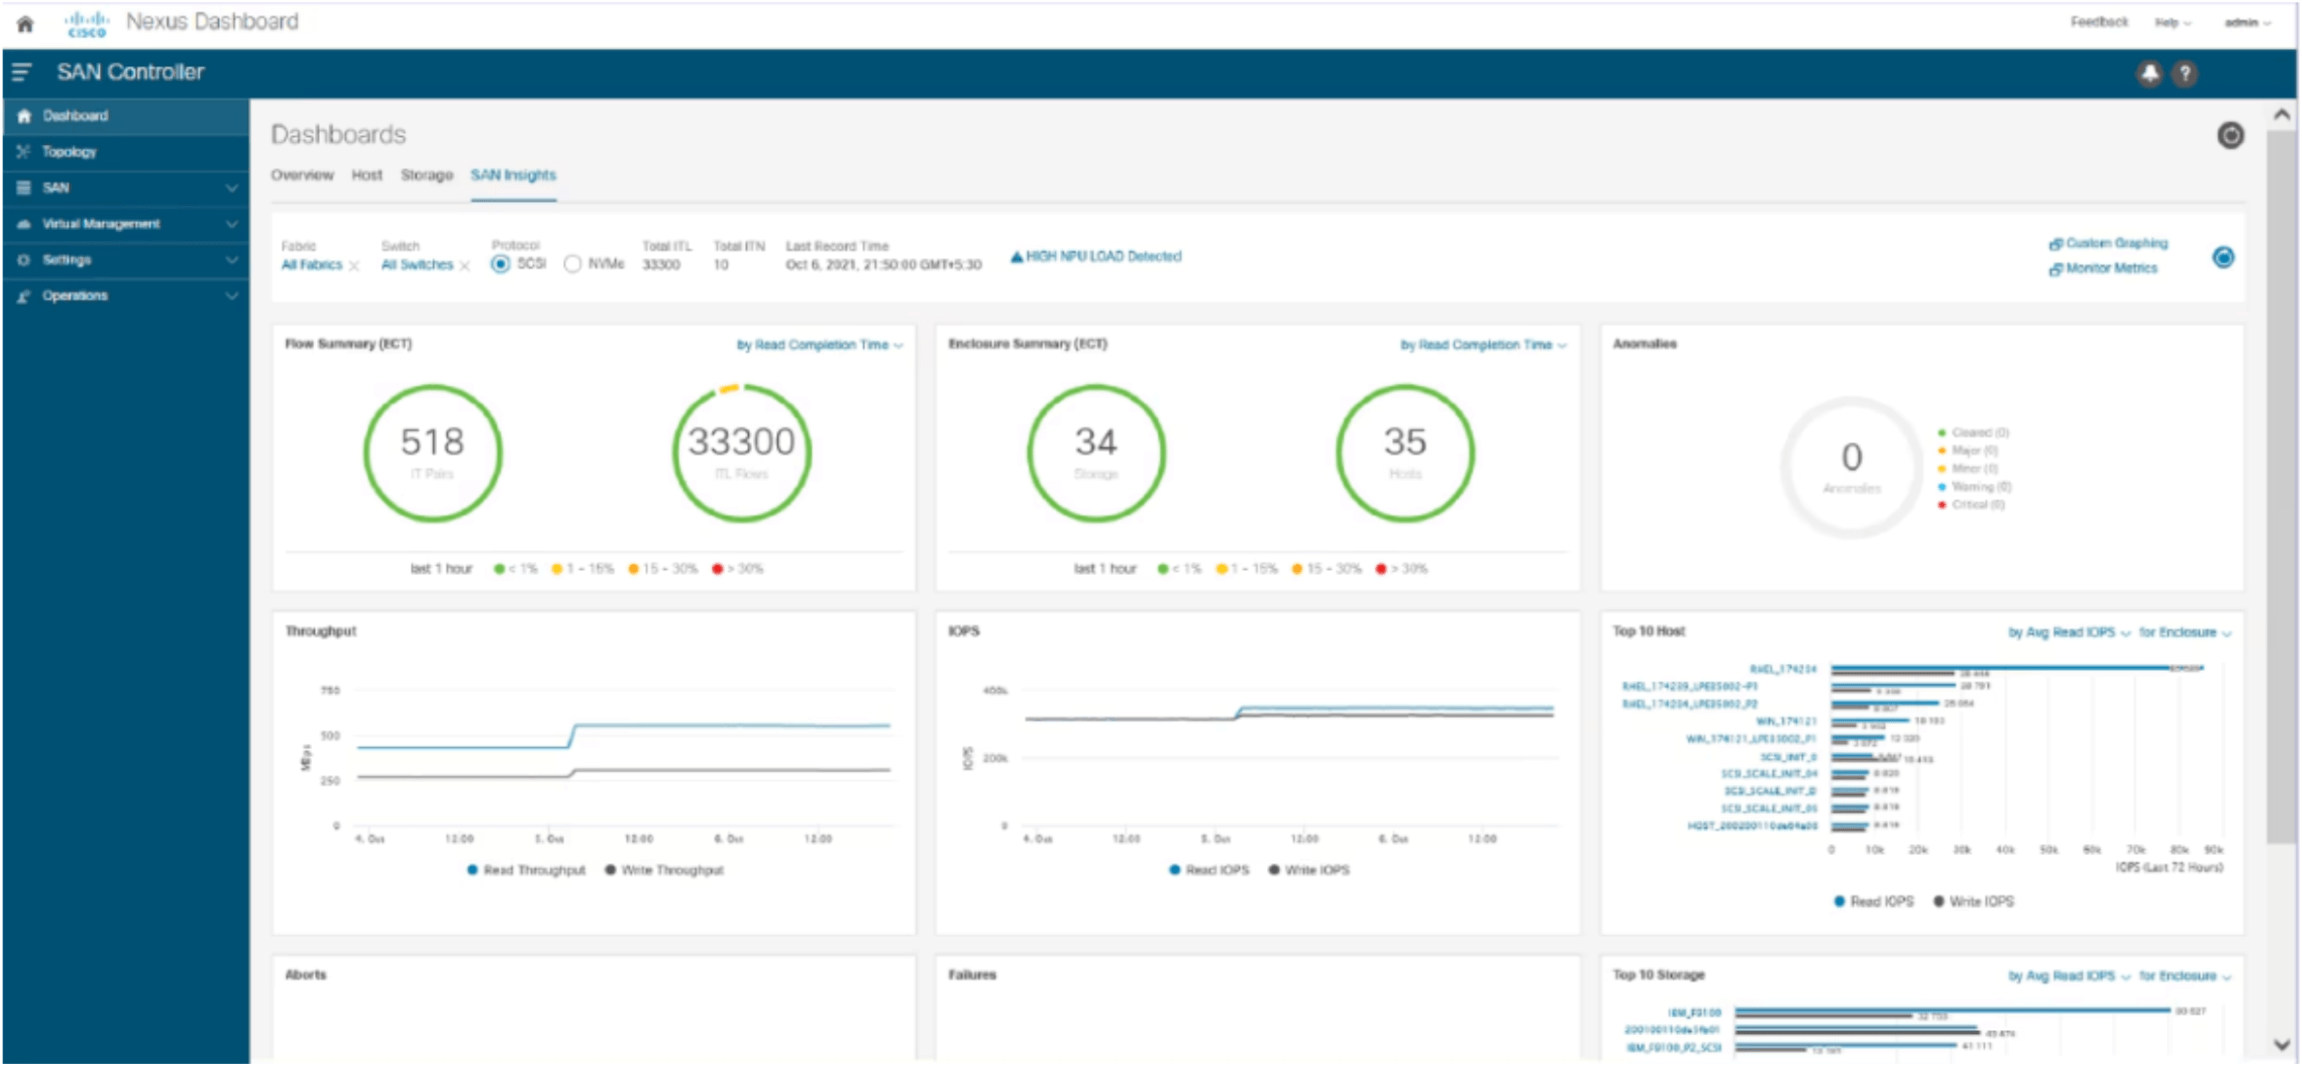
NDFC also features SAN Insight, allowing it to collect telemetry data from MDS switches and generate comprehensive reports. This enables end-to-end management of the SAN network from a single platform.
Conclusion
Cisco SAN Analytics is a technology that addresses the needs of modern storage networks, optimizing performance and providing proactive solutions to potential issues. By ensuring transparent visibility across every layer of the storage infrastructure, it empowers businesses to operate more efficiently and effectively. Transitioning to this technology is not only a strategic move for today but also a crucial step for the data centers of the future.
To learn how you can leverage the features and advantages of Cisco SAN Analytics for your business, contact us today.

